


If you’re curious about Ethereum’s market trends, now might be the time to focus on the Ethereum price as it hovered around $2432 during a U.S. trading session, reflecting a minor dip of 0.3%. This fluctuation represents a neutral candle formation, indicating an equilibrium between buying and selling forces. As the Ethereum price patterns continue to hold steady, here are five compelling reasons that could influence a significant shift in Ether’s trajectory.
Long-Term Prospects: Ethereum’s MVRV Ratios
Data from Santiment reveals that Ethereum’s 365-day Market Value to Realized Value (MVRV) ratio has plateaued at about -13.7%. This metric sheds light on the profitability landscape for Ethereum’s long-term holders. Historically, considerable negative ratios have marked critical market lows, such as those seen in June 2022 and October 2023. Hence, the Ethereum price might gear up for a meaningful recovery in the medium to long term.
Additionally, the short-term MVRV ratio has rebounded recently, tracking returns for investors over the last 30 days. Following a low of -21% in August, it surged to -1.35%, suggesting increasing profitability for short-term holders, which could rekindle buying interest.

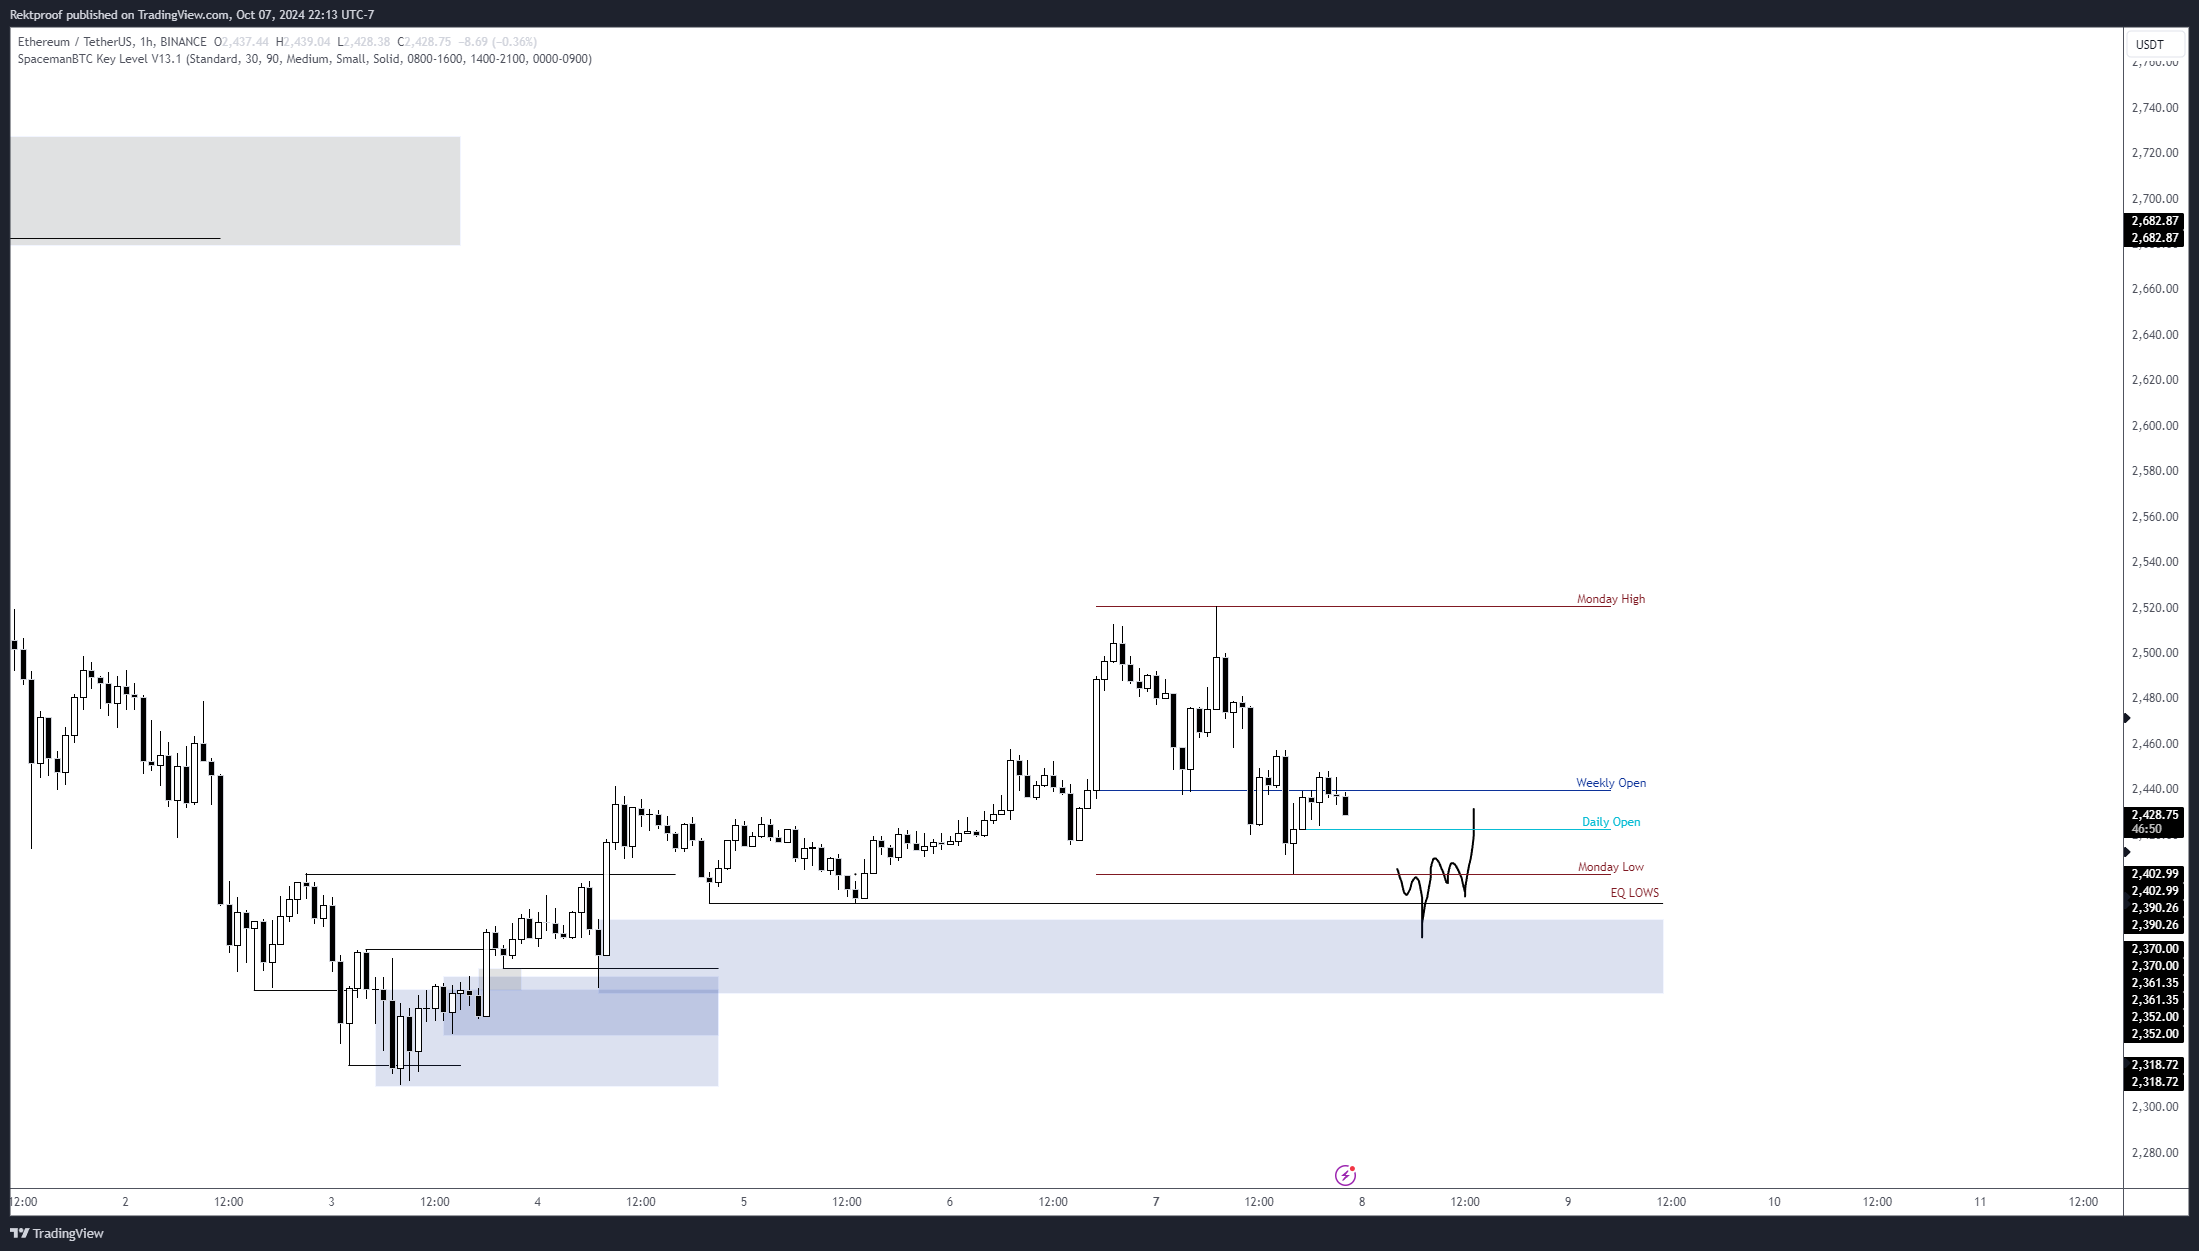
Potential Ethereum Fluctuations to $2350
Ethereum’s price experienced a bounce, climbing from $2300 to $2460—a 6% increase. Yet, the upwards drive was halted at $2460, as indicated by Rektproof’s analysis. Should Bitcoin not gain bullish traction, Ethereum could dip to $2350, potentially re-engaging the bullish setup.
Bearish Signals: Declining Active Addresses
Following the start of October, Ethereum’s 24-hour active addresses fell from 512.8k to 434.2k, indicating a 15% decline. This drop points to reduced user engagement on the network, potentially signaling weakening interest in Ethereum. Meanwhile, the supply on exchanges has risen since July 2024, correlating with a price downturn below $3000, raising bearish concerns.

Moreover, whale activities involving large Ethereum transactions have remained subdued, suggesting cautious behavior among major holders.

Significant Transaction Alert: Ethereum Foundation’s Movement
In a noteworthy transaction, a wallet tied to the Ethereum Foundation moved 2,500 ETH to Bitstamp. Market analyst Lookonchain observes that this wallet had previously received a substantial amount of ETH back in 2015. Such transactions, especially linked to foundational accounts, could trigger market uncertainties, influencing Ethereum price dynamics.
A wallet related to the #EthereumFoundation deposited 1,250 $ETH($3.03M) to #Bitstamp 20 mins ago.
On Nov 17, 2015, the wallet received 51,251 $ETH($51.2K at that time, $124.5M currently) from the #EthereumFoundation.https://t.co/RV8HZrxgKH pic.twitter.com/uHQJH2Itp7
— Lookonchain (@lookonchain) October 8, 2024
Symmetrical Triangle Suggests Future Movement
Ethereum’s price charts also reveal a symmetrical triangle pattern over recent months, pointing to a consolidation phase with converging trendlines. A downward breach could lead to a dip between $2200 and $2000, while a breakout above $2600 could propel Ethereum beyond the $3000 mark.

In conclusion, keeping a close watch on Ethereum price movements is essential for anticipating market trends and making informed trading decisions.
Discover more from Make Money Online and Work From Anywhere
Subscribe to get the latest posts sent to your email.

