


If you’re curious about Ethereum’s market trends, now might be the time to focus on the Ethereum price as it hovered around $2432 during a U.S. trading session, reflecting a minor dip of 0.3%. This fluctuation represents a neutral candle formation, indicating an equilibrium between buying and selling forces. As the Ethereum price patterns continue to hold steady, here are five compelling reasons that could influence a significant shift in Ether’s trajectory.
Long-Term Prospects: Ethereum’s MVRV Ratios
Data from Santiment reveals that Ethereum’s 365-day Market Value to Realized Value (MVRV) ratio has plateaued at about -13.7%. This metric sheds light on the profitability landscape for Ethereum’s long-term holders. Historically, considerable negative ratios have marked critical market lows, such as those seen in June 2022 and October 2023. Hence, the Ethereum price might gear up for a meaningful recovery in the medium to long term.
Additionally, the short-term MVRV ratio has rebounded recently, tracking returns for investors over the last 30 days. Following a low of -21% in August, it surged to -1.35%, suggesting increasing profitability for short-term holders, which could rekindle buying interest.


Potential Ethereum Fluctuations to $2350
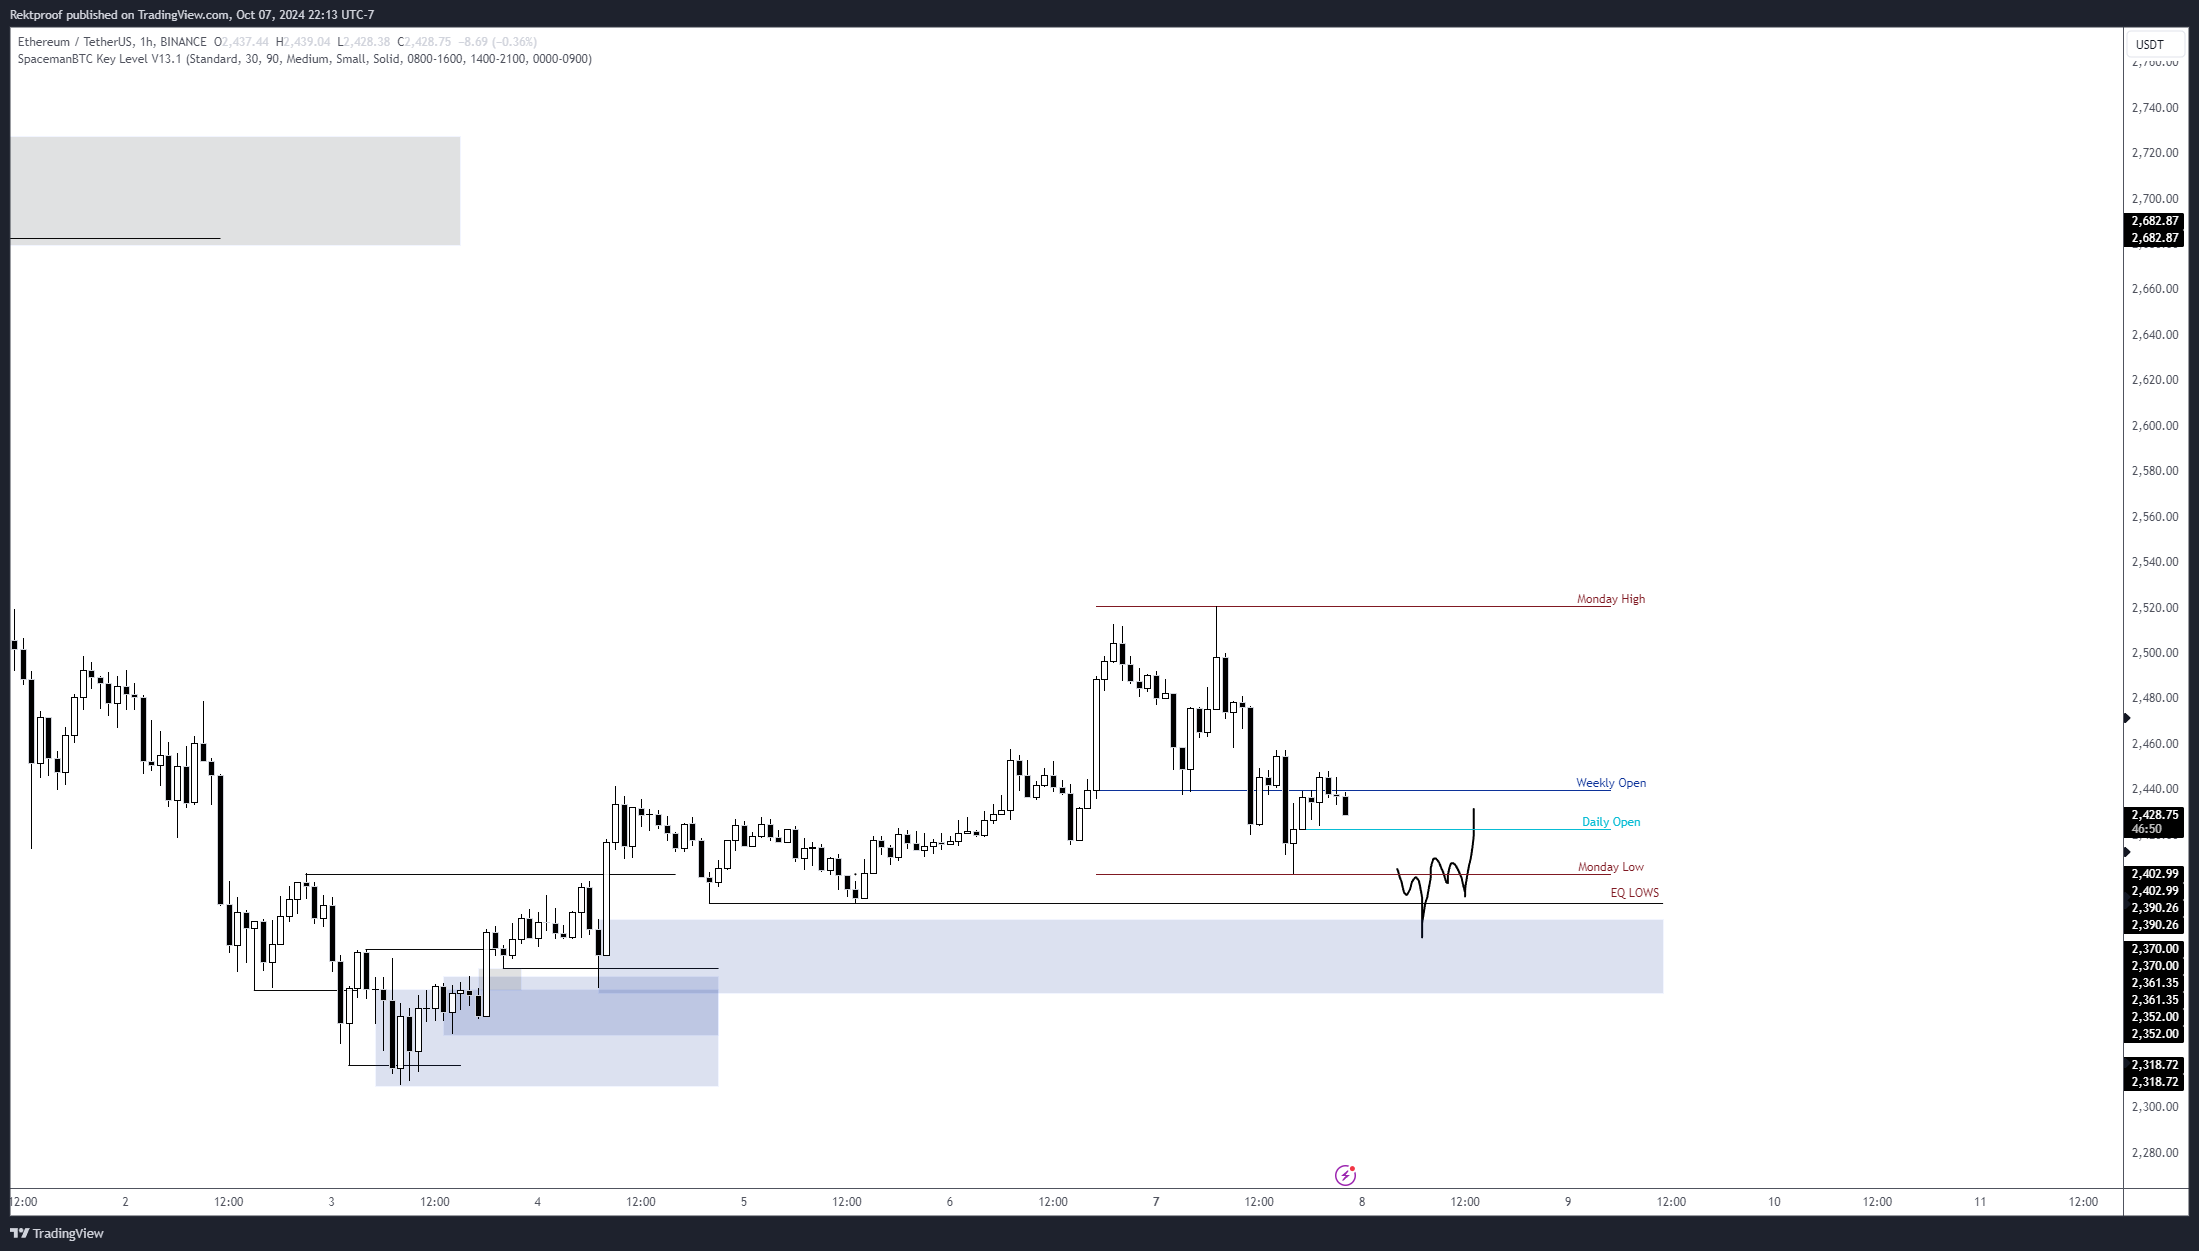
Ethereum’s price experienced a bounce, climbing from $2300 to $2460—a 6% increase. Yet, the upwards drive was halted at $2460, as indicated by Rektproof’s analysis. Should Bitcoin not gain bullish traction, Ethereum could dip to $2350, potentially re-engaging the bullish setup.

Bearish Signals: Declining Active Addresses
Following the start of October, Ethereum’s 24-hour active addresses fell from 512.8k to 434.2k, indicating a 15% decline. This drop points to reduced user engagement on the network, potentially signaling weakening interest in Ethereum. Meanwhile, the supply on exchanges has risen since July 2024, correlating with a price downturn below $3000, raising bearish concerns.

Moreover, whale activities involving large Ethereum transactions have remained subdued, suggesting cautious behavior among major holders.

Significant Transaction Alert: Ethereum Foundation’s Movement
In a noteworthy transaction, a wallet tied to the Ethereum Foundation moved 2,500 ETH to Bitstamp. Market analyst Lookonchain observes that this wallet had previously received a substantial amount of ETH back in 2015. Such transactions, especially linked to foundational accounts, could trigger market uncertainties, influencing Ethereum price dynamics.
A wallet related to the #EthereumFoundation deposited 1,250 $ETH($3.03M) to #Bitstamp 20 mins ago.
On Nov 17, 2015, the wallet received 51,251 $ETH($51.2K at that time, $124.5M currently) from the #EthereumFoundation.https://t.co/RV8HZrxgKH pic.twitter.com/uHQJH2Itp7
— Lookonchain (@lookonchain) October 8, 2024
Symmetrical Triangle Suggests Future Movement
Ethereum’s price charts also reveal a symmetrical triangle pattern over recent months, pointing to a consolidation phase with converging trendlines. A downward breach could lead to a dip between $2200 and $2000, while a breakout above $2600 could propel Ethereum beyond the $3000 mark.


In conclusion, keeping a close watch on Ethereum price movements is essential for anticipating market trends and making informed trading decisions.