


Imagine this: Your manager wants to understand the effectiveness of your social media strategy. You know you’ve driven traffic, converted visitors, and heightened brand awareness. But how can you demonstrate these achievements effectively?
Enter the social media dashboard. Crafting an informative dashboard in three steps can visually showcase the essential metrics that validate the outcomes of your social media actions. As a social media manager, it’s crucial to translate raw social media data into comprehensible insights for diverse audiences, such as your team and company executives.
Beyond showcasing metrics, a well-designed social media dashboard aids in:
- Gleaning actionable insights on which types of posts are gaining traction.
- Identifying campaigns delivering the best return on investment (ROI).
- Allocating marketing resources effectively to platforms yielding the highest impact.
This blog delves into creating a customized social media dashboard. It instructs on selecting pivotal social media metrics, sourcing data, building visualizations, and more, ensuring you craft an invaluable tool for your marketing arsenal.
Step-by-Step Guide: Crafting a Tailored Social Media Dashboard
Defining the Audience for Your Social Media Dashboard
Personalization is key for crafting a relevant social media reporting dashboard. You likely communicate with a broad range of stakeholders, each possessing different understandings of social media dynamics. Executives might require insights into how marketing dollars are being utilized effectively. On the other hand, your social media team, already familiar with the strategy, might benefit from execution-focused dashboards.
Why Customize Your Social Media Dashboard?
Instead of using templated dashboards, which often require constant adjustments, using custom setups tailored to the user’s expertise can be more efficient and precise.
Here are some key questions to consider when building your social media dashboard:
- Who is the intended recipient of the dashboard?
- What knowledge do they already possess about your social strategies?
- Which analytics are most valuable to their decision-making?
- What is their preferred method of data interpretation?
Answering these queries ensures your social media dashboard effectively caters to the unique needs of its users.
Step 1: Gathering Essential Data Points
Start by extracting key performance metrics natively available from your social media platforms. Use Google Analytics for insights into social media-driven website traffic. Each platform provides varying levels of data detail, covering essentials like reach, follower growth, and audience demographics.
Your social media dashboard might prioritize different metrics based on your objectives for each platform. For instance, distinguish between brand awareness efforts on Facebook and conversion-focused campaigns on TikTok.
Social media strategist Bella Rose Mortel of Beehiiv highlights vital statistics: impressions, follower count, shares, and saves. She says:
“Monitoring impressions and follower growth underscores successful visibility and engagement goals, while share and save metrics indicate the content’s broader appeal and user intent to revisit.”
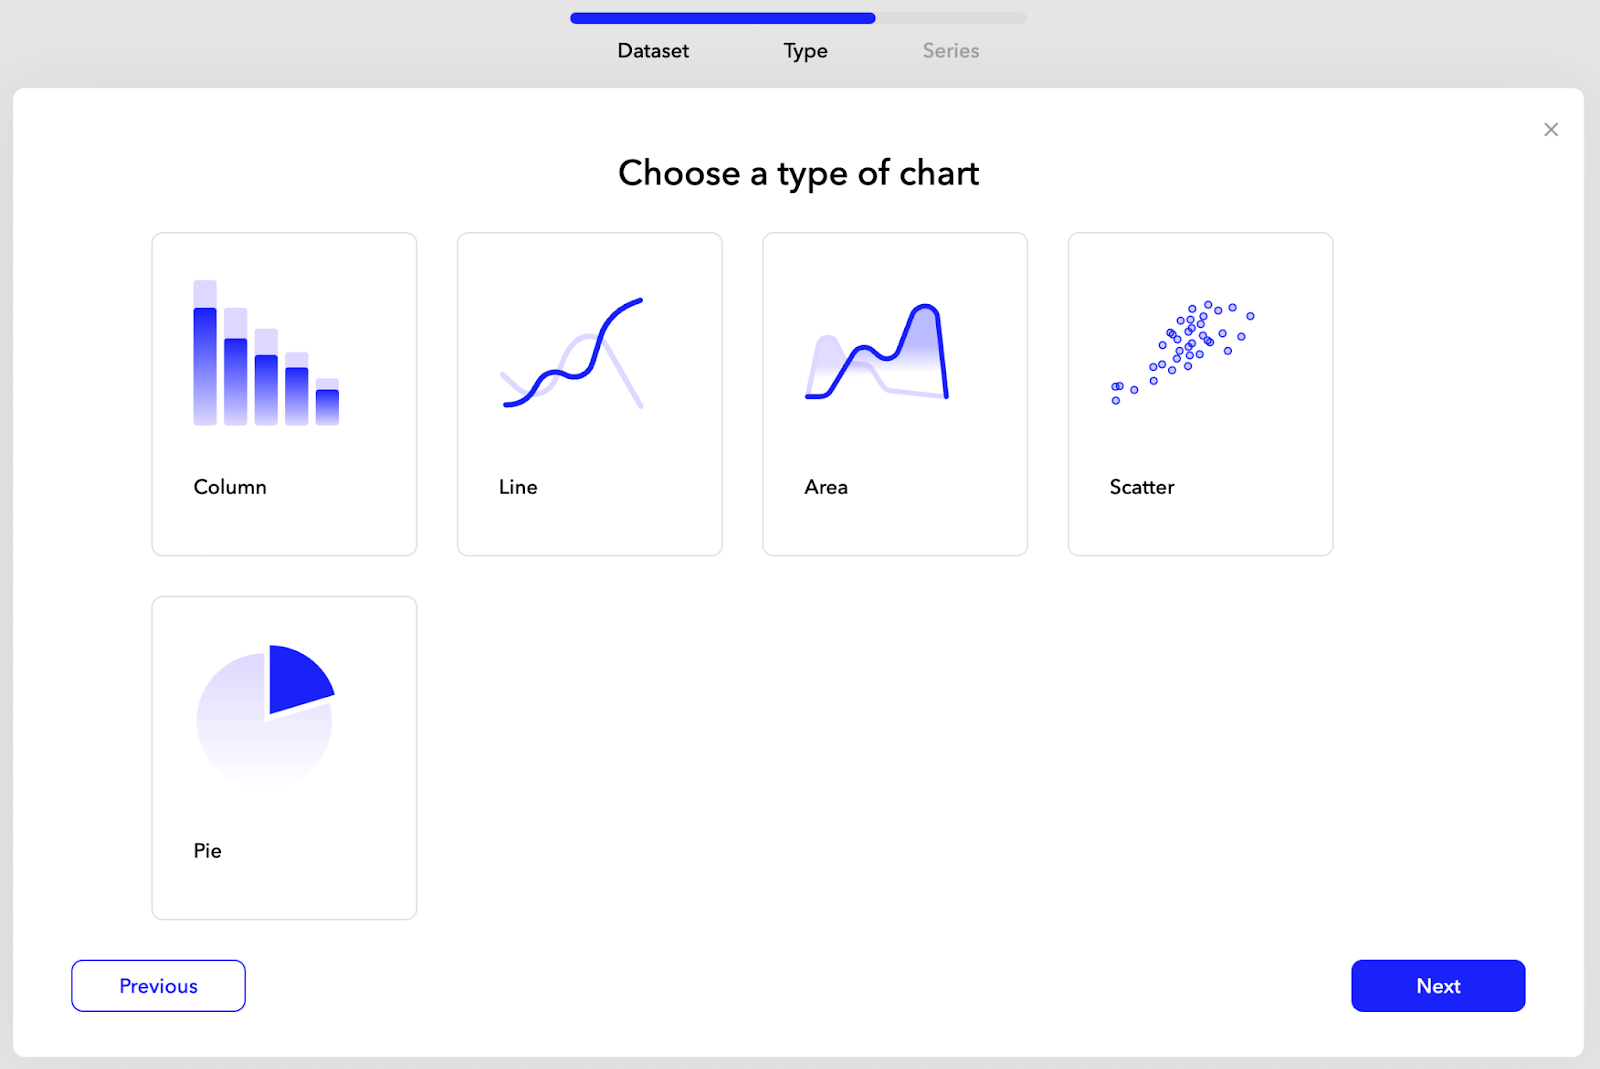
Step 2: Visualizing Your Data Effectively
To bring clarity to your social media insights, employ data visualization tools like Google Looker Studio or ChartBlocks. These platforms enable you to turn raw data from Google Sheets into visually intuitive graphs and charts for clearer understanding.
Step 3: Organizing and Presenting Your Insights
Convert your charts into valuable insights by following an organized presentation format. Focus on key metrics and insights upfront and provide comprehensive explanations for each data point.
Your dashboard should articulate the relationships between social media engagement and overall business objectives. Highlight any external factors impacting your data, and consider incorporating qualitative findings to paint a holistic picture.
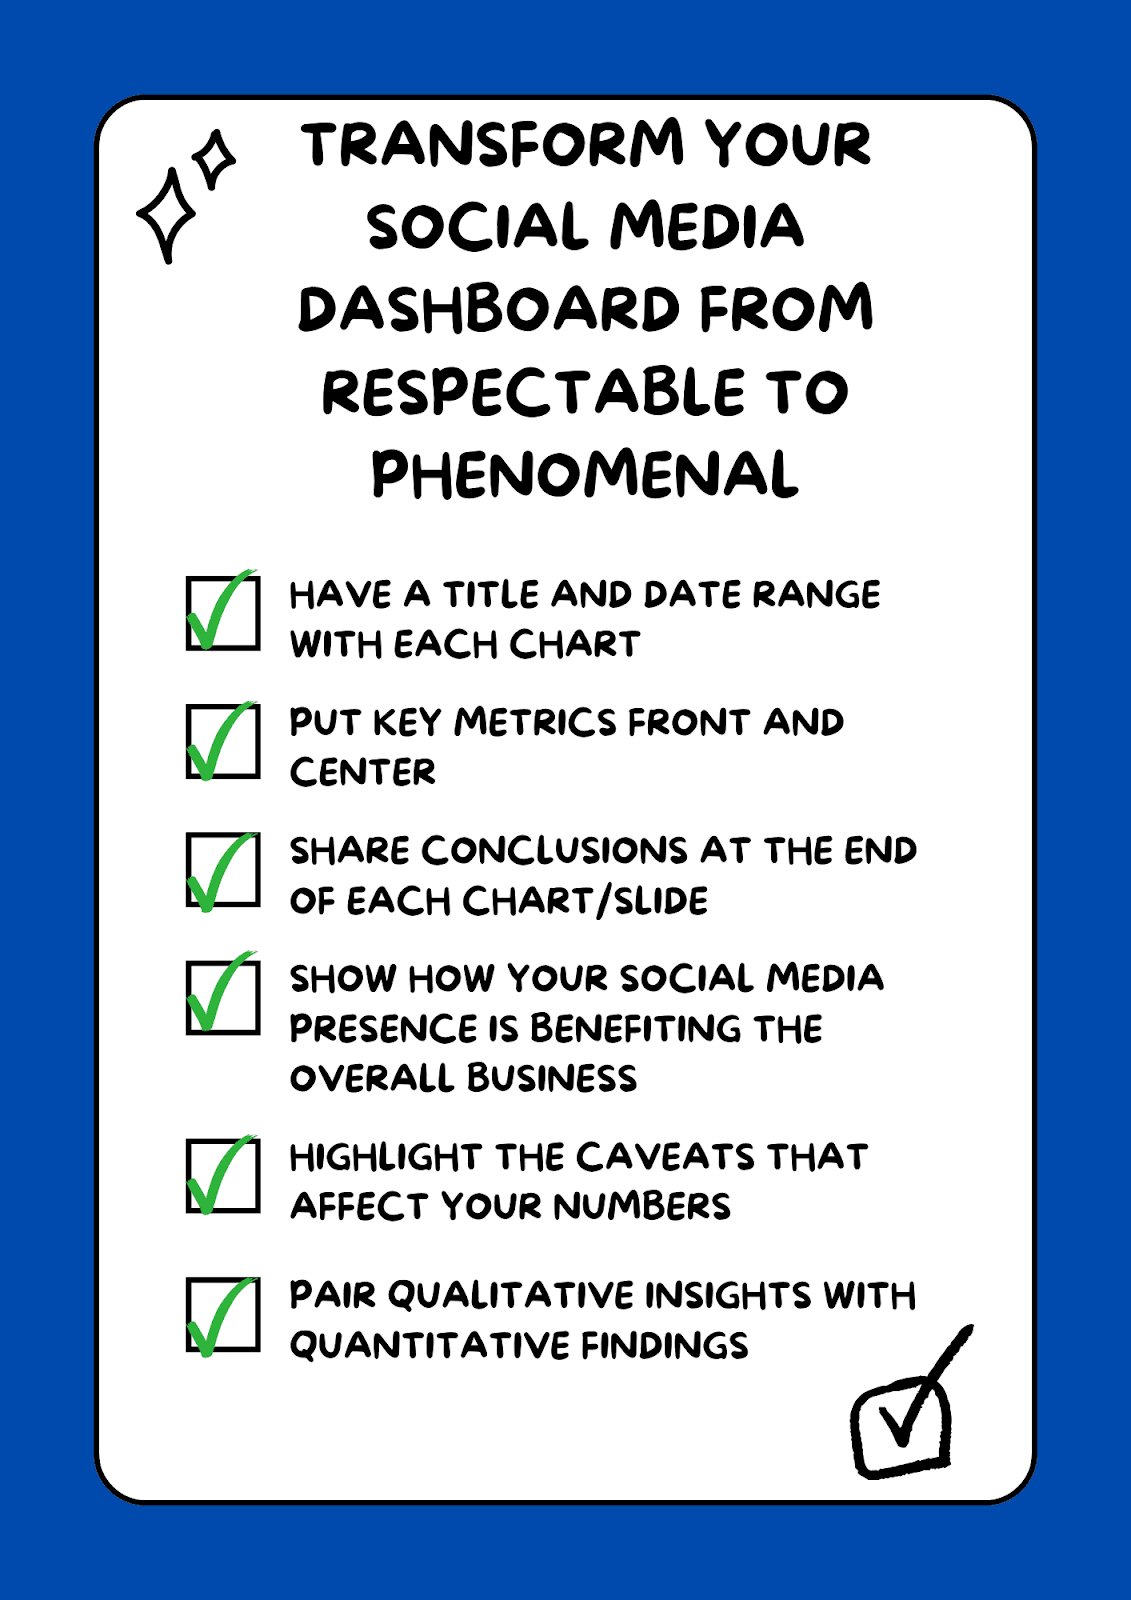
Ensure that each chart features titles and time frames, facilitate rapid comprehension of critical insights, and share conclusions with actionable recommendations.
Ready to streamline your strategy with more insights and marketing techniques? Click here for more marketing tips and strategies.
Discover more from Make Money Online and Work From Anywhere
Subscribe to get the latest posts sent to your email.

